What a Structural Warning Looks Like
Late yesterday, Storm Center flagged a Structural Warning on our FlightDeck platform. That is the second-highest alert level in a system calibrated against 25 years of resolved market episodes. Why is this happening, and why are we taking it seriously?
Storm Center scores the current market environment on a 0-to-8 scale using four independent indicators. Each one contributes 0, 1, or 2 points based on clearly defined thresholds. There are no judgment calls and no narrative overlays. Here are the readings from yesterday, March 20, 2026:
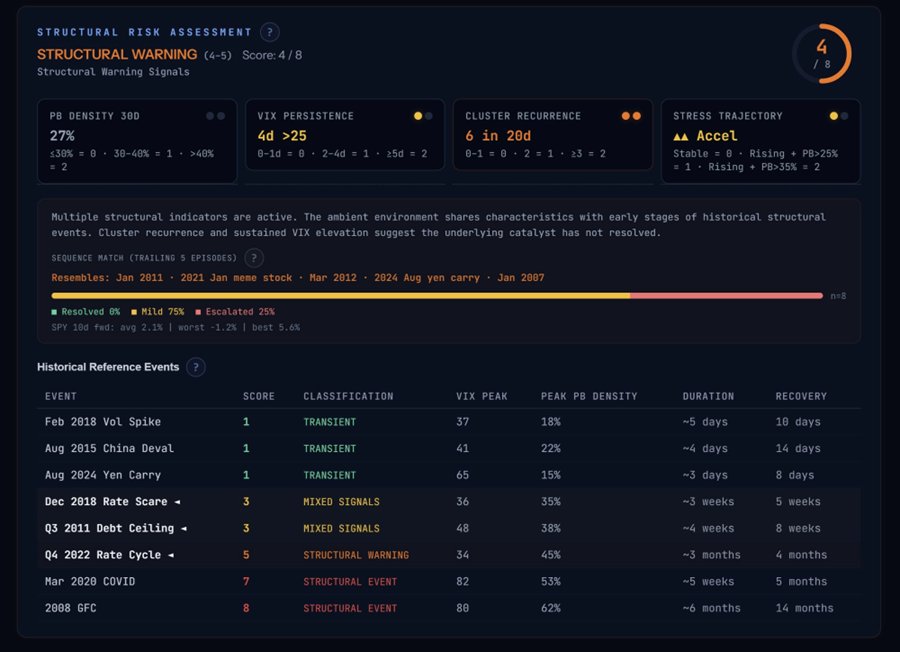
PB Density 30D measures what percentage of the last 30 trading days were what we call "Pure Beta" days. These are days where the broad market moved more than roughly 1% and stocks moved together so tightly that individual stock selection was effectively drowned out by the market wave. At 27%, more than one in four recent trading days has been dominated by this kind of lockstep movement. That nearly crosses our first threshold but scores 0 points.
VIX Persistence tracks how many consecutive days the VIX (a widely followed measure of expected market volatility) has stayed above 25. That level marks the boundary between what we call an Elevated environment and a Stress environment. Four consecutive days above 25 scores 1 point. The significance is duration: a one-day VIX spike is noise. Four consecutive days means the options market is pricing in sustained uncertainty, not just a fleeting reaction to a single headline.
Cluster Recurrence counts how many separate clusters of Pure Beta days have occurred in the last 20 trading days. Six clusters in 20 days scores the maximum 2 points. This is the indicator flashing hardest right now. When these clusters keep recurring rather than resolving cleanly, it is the statistical fingerprint of a market environment that has not yet found stable footing.
Stress Trajectory evaluates whether conditions are stable, rising, or accelerating. The current reading is "Accel," meaning PB density has crossed 25% and the trend is still climbing. That scores 1 point.
The composite score is 4 out of 8. That places us in the Structural Warning band (4-5), above Mixed Signals (2-3) and below the two highest tiers: Structural Event (6-7) and the maximum severity level that corresponds to episodes like the 2008 financial crisis and the onset of COVID.
The Historical Reference Events table at the bottom of the panel shows how past market episodes resolved across the full severity spectrum, all scored by the same methodology for greater context. The episodes that most closely resemble the current signature, and then started to resolve rather than get worse, are Feb 2018 Vol Spike, Aug 2015 China Deval, and Aug 2024 Yen Carry. All three resolved as Transient events within days because the triggering event turned out to be the peak of the problem.
We do not see this starting to resolve on Monday, March 24. The oil supply disruption is growing worse, not better, and that trajectory looks likely to continue for at least the next several weeks.
Knowing that we are at the edge of a structural market event is a warning worth heeding when the Strait of Hormuz will remain closed for some time and damage to oil infrastructure that will take years to repair has already begun, and when upside/downside risks are flipping to the downside.
The second panel shows what we call the active cluster analysis. Think of a "cluster" as a streak of consecutive Pure Beta days. This tool is calibrated on 1,120 such clusters observed across 25 years of market history.
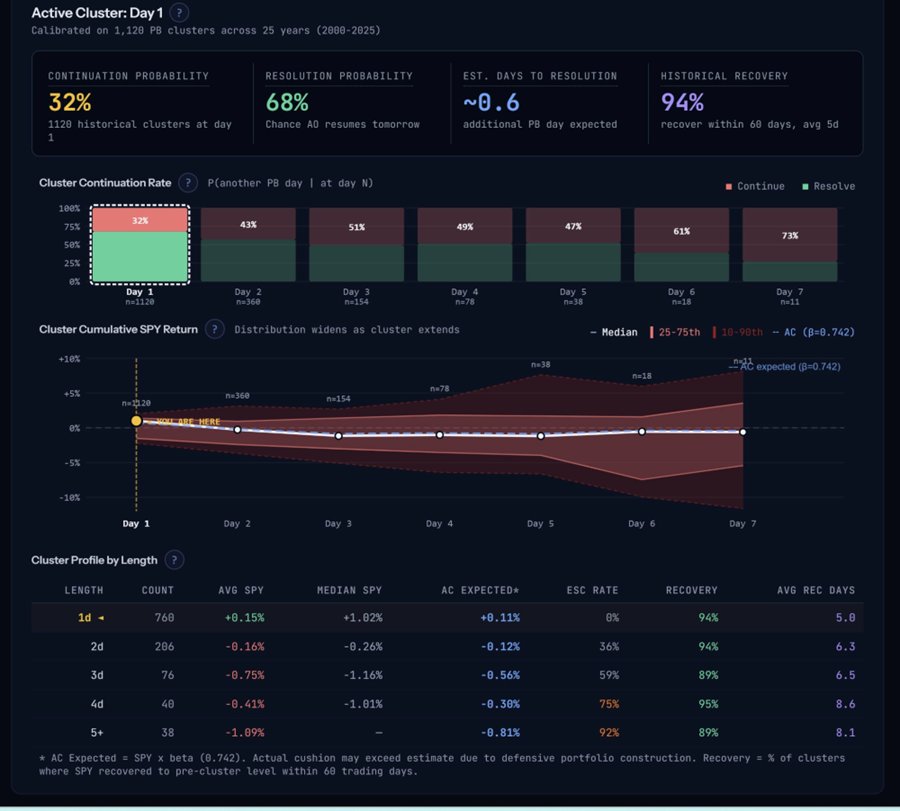
We are at Day 1 of a new cluster and importantly not a new event. Of the 1,120 historical Day 1 clusters, 32% continued into a second day and 68% resolved, meaning the market returned to normal conditions. The historical recovery rate for Day 1 clusters is 94%, meaning that in the vast majority of cases, the S&P 500 recovered to pre-cluster levels within 60 trading days, with an average recovery time of just 5 days.
Those numbers sound reassuring on their own. They should not be. Look at the Cluster Continuation Rate chart: once a cluster reaches Day 2, the probability of further continuation rises to 43%. At Day 3 it hits 51%, and it keeps climbing from there. The distribution of outcomes fans outward with each passing day. The clusters that are still active by Day 5 represent the dangerous tail of the distribution.
The Cluster Profile by Length table puts numbers to this pattern. One-day clusters have an average S&P 500 return of +0.15% with a 0% escalation rate. Two-day clusters flip negative: -0.16% average return with 36% escalating into something worse. Three-day clusters average -0.75% with 59% escalating. By the time a cluster extends to five or more days, the average return is -1.09% and 92% of those clusters escalated historically.
This is why we pay attention on Day 1, even though Day 1 itself has a 68% resolution probability. The asymmetry is what matters: if it resolves, recovery is fast and unremarkable. If it does not, each additional day compounds both the size and likelihood of a serious drawdown.
We reallocated a portion of our equity exposure into short-term government bond funds. This does not eliminate equity risk and is not intended to. The goal is to reduce how much of the portfolio moves with the broad stock market during a period where the balance between potential reward and potential risk has shifted unfavorably.
The reasoning is straightforward. When our instruments place the probability of a true structural event above 50%, the math changes. Missing a few days of market recovery in an environment that resolves quickly costs relatively little. Being fully exposed during the early stages of a structural event can cost a great deal. Short-term government bonds give us a safe place to park capital with minimal interest rate risk while we wait for either resolution or further escalation.
This is a proportional response, not a panic response. We have not gone to cash. Additionally, we will adjust our stock selection using our protocols for structural events as the crisis deepens.
Storm Center and the full suite of FlightDeck instruments are live for anyone to see at our operations center. Everything described in this article is visible, interactive, and completely free of gimmicks or email addresses required, unless you want to subscribe to our free Storm Watch alert service.
Day 1 is the cheapest day to pay attention. Every day after that, the price goes up.
This publication is provided by Life UnLocked Partners LLC ("LUL"), a registered investment advisor with the California Department of Financial Protection and Innovation (DFPI), CRD# 318642. The content is for educational and informational purposes only and does not constitute investment advice, a recommendation, or a solicitation to buy or sell any security or to employ any particular investment strategy. Nothing in this publication should be interpreted as a recommendation to purchase, sell, or hold any particular investment or security.
The analytical framework, tools, and methodologies discussed herein are presented for educational purposes. They are not designed or intended to be used as stock-picking devices, trading signals, or the basis for any investment decision. Past performance, whether of the framework, any fund, or any strategy referenced, is not indicative of future results.
All investments involve risk, including the possible loss of principal. The information presented is based on data and analysis believed to be reliable, but LUL makes no representation or warranty as to its accuracy, completeness, or timeliness. Market conditions, economic factors, and individual circumstances vary, and outcomes may differ materially from any examples or historical patterns discussed.
LUL is registered as an investment advisor with the California Department of Financial Protection and Innovation (DFPI). Registration does not imply a particular level of skill or training, nor does it constitute an endorsement by any regulatory authority.
For more information about Life UnLocked Partners LLC, including our advisory services, fees, and business practices, please refer to our Form ADV, available through the SEC's Investment Adviser Public Disclosure website at adviserinfo.sec.gov.
This publication does not create an advisory relationship between LUL and any reader. Readers should consult their own financial advisor, tax professional, or legal counsel before making any investment decisions.